Clean water can look perfectly clear while carrying invisible risks. A Water Quality Monitor helps reveal those risks by measuring conditions that human senses cannot reliably detect. Depending on its design, the device may track pH, temperature, turbidity, electrical conductivity, dissolved oxygen, chlorine, or specific contaminants. These readings support decisions in drinking-water treatment, aquaculture, industrial facilities, agriculture, and environmental research.
Professor David Sedlak, a respected water-quality researcher at the University of California, Berkeley, has said, “Water is the new oil.” The statement sounds simple, but it reflects a serious reality: reliable water data has growing economic, public-health, and environmental value. A modern Water Quality Monitor usually places sensors directly in a water stream, records measurements at set intervals, and sends results to a screen, database, or cloud platform. Some systems can trigger an alert when values move beyond a selected limit.
The process is not magic. Sensors require calibration, cleaning, and periodic comparison with laboratory methods. Mud, algae, air bubbles, temperature changes, and damaged probes can distort results. A low-cost monitor may also provide useful trends without proving that water is safe to drink. That distinction matters.
A monitor is not an oracle.
This guide will explain how these instruments work, what each sensor measures, and where their limits appear in real conditions. It will also consider installation, maintenance, data interpretation, and practical purchasing questions. The technology is valuable, yet it still needs trained people, documented procedures, and a willingness to question surprising results.
A water quality monitor is a device that measures chemical, physical, or biological conditions in water. It usually combines a controller, data logger, and replaceable probes. Common parameters include temperature, pH, electrical conductivity, dissolved oxygen, turbidity, oxidation-reduction potential, and residual chlorine. Some systems also estimate nutrients or detect microbial contamination through laboratory-linked sensors. The WHO and UNICEF Joint Monitoring Programme reported that 2.2 billion people lacked safely managed drinking water in 2022. Reliable monitoring therefore supports public health, not only technical compliance.
Probes contact the water and convert changes into electrical signals. The monitor then displays readings, stores trends, or sends alerts when values exceed selected limits. A pH probe may show unstable results after fouling. Conductivity can rise sharply near a saltwater intrusion zone. Small details matter. The U.S. EPA’s field procedures emphasize calibration, temperature compensation, cleaning, and quality-control checks before sampling. A single reading is rarely enough. That is an important limitation.
Use cases range from drinking-water treatment and rivers to aquaculture, industrial discharge, and irrigation. Operators may track dissolved oxygen before fish become stressed, or turbidity after heavy rain. The UN World Water Development Report 2024 highlights growing pressure on freshwater systems from climate change and pollution. However, monitors do not identify every contaminant. Sensor drift, bubbles, biofilm, and poor placement can mislead even experienced users. Good practice compares sensor data with laboratory results and keeps a clear maintenance record.
A water quality monitor is a field instrument that checks key conditions in water. It uses sensors to measure pH, turbidity, conductivity, temperature, and sometimes dissolved oxygen. The device sends electrical signals to a display or data system. This helps operators spot changes before they become serious problems. Still, a monitor does not replace trained sampling or laboratory testing. Sensor readings need context.
For many freshwater applications, pH between 6.5 and 8.5 is a useful reference range. Turbidity should remain at or below 0.3 NTU when clear water is expected. Higher turbidity may indicate suspended soil, organic matter, or disturbed sediment. Conductivity shows how easily water carries an electrical current. It often reflects dissolved ions, but its acceptable value depends on the water source. Temperature affects conductivity, so reliable monitors compensate for it. A clean-looking sample can still have unusual conductivity. That detail is easy to miss.
Tips: Calibrate pH sensors with fresh standards before important measurements. Rinse the probe with clean water between locations. Avoid touching the sensing surface. Record the sampling time, temperature, weather, and exact location. Compare results with previous readings, not one isolated number. If turbidity rises suddenly, check for air bubbles, a dirty sensor, or recent rainfall. Even careful measurements can be imperfect. Rechecking is worthwhile.
What Is a Water Quality Monitor and How Does It Work?
A water quality monitor turns changing water chemistry into measurable digital information. The process starts with sampling. Water may flow continuously through a chamber, or a technician may place a probe directly into a river, tank, or treatment channel. The sampling point matters because temperature, depth, flow, and nearby sediment can change the reading. A single sample may not represent the whole water body. That is an easy mistake to make.
Inside the probe, different sensors respond to specific properties. A pH sensor measures hydrogen ion activity through an electrical potential. A conductivity sensor detects how easily dissolved ions carry current. Optical sensors estimate dissolved oxygen or turbidity by measuring light absorption, scattering, or fluorescence. Temperature compensation helps correct readings because chemical reactions and sensor responses shift with heat. The monitor converts these signals into numerical values, timestamps, and sometimes warning thresholds. The chemistry becomes data.
Reliable results require careful handling. Field technicians usually rinse probes, inspect membranes, remove deposits, and calibrate sensors against known reference solutions. Calibration can drift. Biofilm, air bubbles, damaged cables, or poor water circulation may produce convincing but inaccurate numbers. Data should be checked against recent conditions and, when possible, laboratory samples. I would not treat an unusual reading as proof of contamination immediately. Repeating the measurement, recording weather and flow, and checking sensor condition can reveal whether the water changed or the instrument did.
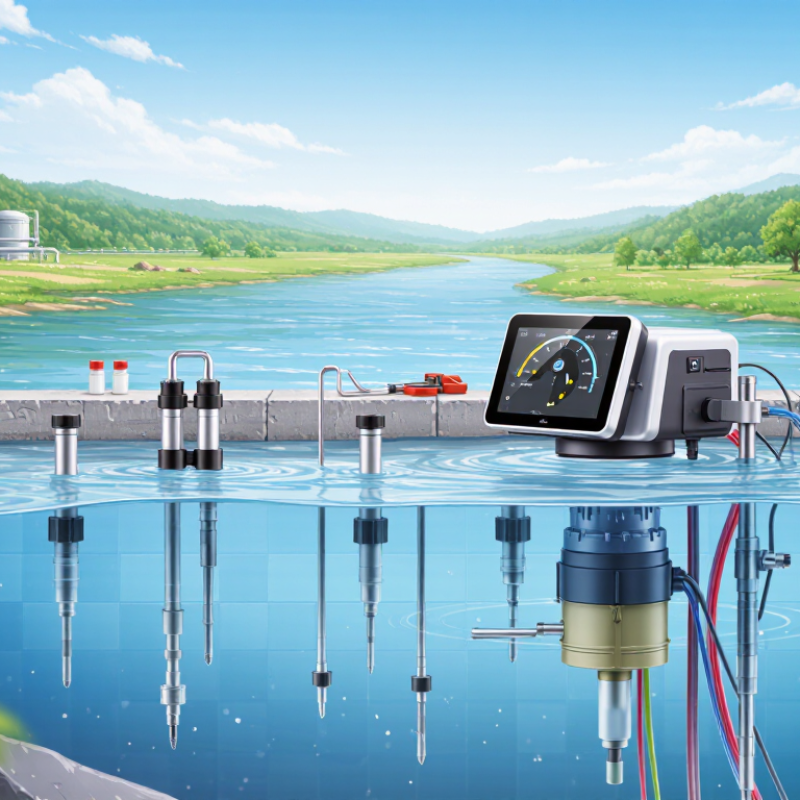
Sampling probes measure chemical and physical conditions in water and convert them into digital readings. The chart below shows representative measurements recorded at five sampling points.
How to read the chart: pH indicates acidity or alkalinity, dissolved oxygen shows the oxygen available for aquatic life, and turbidity measures water clarity. A probe samples the water, detects these properties with sensors, and sends the signals to a monitor for processing and display.
A water quality monitor measures conditions that affect drinking water safety. It may track free chlorine, pH, temperature, turbidity, and electrical conductivity. Optical systems compare a water sample with a light signal. Electrochemical sensors detect chemical changes at a sensing surface. The device then converts those signals into readable values.
Free chlorine deserves careful interpretation. WHO identifies at least 0.2 mg/L at delivery as a useful target for maintaining disinfection protection. A reading below this level may indicate chlorine loss during storage or distribution. A reading far above it may create taste concerns and deserves investigation. The measurement should be taken from the actual delivery point, such as a household tap, not only at the treatment outlet.
Check the sample first.
Clean containers matter. Residual chlorine can change quickly after collection, especially in sunlight or warm conditions. Temperature, pH, organic matter, and sampling time can also affect results. A monitor is not a complete safety certificate. Turbidity may remain low while another contaminant is present. Calibration records, control samples, and repeated readings improve reliability. Still, one result can mislead. I would record the location, time, water temperature, and recent flushing activity before interpreting a 0.2 mg/L result. The number matters, but its context matters too.
A water quality monitor measures conditions that can change within minutes. Common parameters include pH, temperature, dissolved oxygen, conductivity, and turbidity. Each sensor produces data that needs technical interpretation. A number alone is not evidence of compliance.
Calibration connects sensor readings to known reference standards. Field staff should calibrate before deployment and verify performance afterward. EPA methods may specify procedures, preservation, holding times, and analytical quality controls. Direct-reading sensors may support monitoring, but they do not automatically replace laboratory methods required by a permit.
QA/QC protects the credibility of every result. Teams can use calibration checks, blanks, duplicates, and documented maintenance records. Continuous systems also require checks for drift, fouling, air bubbles, damaged cables, and unusual spikes. Real sites are rarely clean.
A muddy stream can cover an optical surface within days. A loose fitting can create believable but false readings. Data validation should flag gaps, flat lines, sudden jumps, and values outside physical limits. Operators should record weather, cleaning, calibration standards, and corrective actions. This record helps reviewers understand what happened, not just what the screen displayed.
Compliance decisions should follow the applicable permit and approved method. Requirements can differ by location, parameter, and reporting program. Experienced technicians still question convenient results. Sometimes, the instrument is wrong. Regular comparison with laboratory samples can reveal that weakness before it affects a regulatory report.
| Water-Quality Parameter | How the Monitor Works | Representative EPA Method or Reference | Typical Calibration Practice | Key QA/QC Controls | Continuous-Monitoring Considerations | Compliance Relevance |
|---|---|---|---|---|---|---|
| Temperature | A thermistor or resistance temperature detector measures the change in electrical resistance associated with water temperature. | EPA Method 170.1, commonly used for temperature measurement by thermometric procedures. | Verify against a traceable thermometer or certified reference bath at points covering the expected operating range. | Document reference-device identification, verification results, instrument condition, and corrective action for failed checks. | Use a protective housing and adequate flow; compensate for solar heating, fouling, and abrupt changes in installation depth. | May be regulated through discharge permits, thermal criteria, aquatic-life protection requirements, or process-control limits. |
| pH | A glass or solid-state electrode develops an electrical potential related to hydrogen-ion activity, which is converted to pH. | EPA Method 150.1, electrometric measurement of pH. | Use at least two certified buffer solutions that bracket the expected sample range; perform a slope and offset check according to the approved SOP. | Use fresh buffers, rinse between standards, prevent carryover, record temperature compensation, and verify calibration with an independent check standard. | Control biofouling and coating, maintain stable flow, and flag readings outside the configured operating range or with abnormal drift. | Frequently included in wastewater discharge permits and water-quality criteria; allowable limits are site- and permit-specific. |
| Specific Conductance | Two or four electrodes measure the water’s conductance, which is normalized to a standard cell constant and often temperature-compensated. | EPA Method 120.1, measurement of specific conductance by electrical conductivity. | Use a certified conductivity standard near the expected range; confirm the cell constant and temperature-compensation settings. | Check for air bubbles, electrode coating, contamination, standard expiration, and agreement with an independent laboratory or field measurement. | Temperature compensation must be configured consistently; fouling and trapped air can produce biased readings. | Used for salinity, dissolved-solids screening, intrusion investigations, process control, and permit-specific monitoring. |
| Dissolved Oxygen | An electrochemical membrane sensor measures oxygen reduction current; optical sensors measure oxygen-dependent luminescence quenching. | EPA Method 360.1, membrane-electrode measurement of dissolved oxygen; approved procedures may vary by program. | Perform air-saturation or water-saturation calibration as specified by the approved SOP, with correction for temperature, pressure, and salinity. | Inspect membranes or optical caps, verify response time, conduct field checks, and compare selected results with an independent method. | Provide sufficient flow or mixing; prevent bubbles, sediment deposition, and biological growth around the sensing element. | Important for biological treatment control, aquatic-life protection, oxygen-demand assessment, and certain discharge or receiving-water limits. |
| Turbidity | A nephelometric sensor estimates suspended-particle scattering, generally reporting results in nephelometric turbidity units. | EPA Method 180.1, nephelometric measurement of turbidity. | Use certified turbidity standards covering the expected range; verify zero or low-level response and inspect the optical path. | Use clean sample cells or optical windows, control bubbles, perform duplicate checks, and document standard lot, value, and expiration. | Wipers or cleaning systems may reduce fouling; automatic alarms should distinguish genuine spikes from bubbles or sediment disturbance. | Used in drinking-water treatment, stormwater, sediment studies, and permit-specific effluent or source-water requirements. |
| Free or Total Residual Chlorine | Colorimetric instruments or amperometric sensors quantify chlorine species after chemical reaction or electrochemical detection. | EPA Method 334.0 is an online chlorine monitoring procedure; the applicable approved method depends on the regulatory program and measurement purpose. | Check zero response and verify with a certified standard or independently analyzed sample; follow reagent and membrane replacement requirements. | Track reagent blanks, calibration checks, sample temperature, pH effects, interferences, and agreement with a recognized bench method. | Maintain constant sample flow and reagent supply; alarms should identify low disinfectant, high disinfectant, loss of flow, and analyzer faults. | Supports disinfection control and may be subject to drinking-water, wastewater, reclaimed-water, or permit-specific residual requirements. |
| Oxidation-Reduction Potential | An inert metal electrode measures the potential difference between the process electrode and a reference electrode. | No single universal EPA compliance method is applicable to all ORP uses; the approved project or permit method governs. | Verify using a certified redox reference solution and record stabilization time, temperature, and observed millivolt value. | Inspect the reference junction, remove coating, document response stability, and compare with process indicators rather than relying on ORP alone. | The reading is matrix-dependent; use trend alarms and process-specific control limits instead of assuming a universal pass/fail value. | Commonly used for treatment-process control, but regulatory acceptance depends on the applicable permit, SOP, and monitoring plan. |
| Nitrate-N | Ultraviolet absorbance, ion-selective electrodes, or reagent-based analyzers estimate nitrate concentration; matrix compensation is often required. | EPA Method 353.2 is a colorimetric flow-injection method for nitrate-nitrite nitrogen; online sensor use must follow the approved monitoring plan. | Use multi-point standards across the expected range and verify results with an independent laboratory or reference method. | Evaluate chloride, organic matter, turbidity, temperature, drift, blanks, matrix spikes, duplicates, and recovery acceptance criteria. | Continuous readings require stable flow, periodic cleaning, automatic validation flags, and correlation to discrete laboratory samples. | Relevant to nutrient management, drinking-water protection, wastewater treatment, and watershed monitoring; limits vary by program. |
Hi! Simply click below and type your query.
Our experts will reply you very soon.
